SEE ALL OF YOUR DATA IN ONE PLACE, NO MATTER WHERE IT COMES FROM

In the era of big data, and now big voice, successful enterprises are taking advantage of data visualization with open BI tools like Yellowfin or Tableau. It turns out, when you’re able to detect trends and make predictions with your organization’s data, what you can learn and discover is extremely powerful. Now, it is easier than ever for businesses of any size to gather actionable intelligence from the rich data that has alluded us all for far too long – ‘spoken data’. Everyone makes better decisions with easy access to powerful, interactive analytics, now you can increase the value of your existing analytics platform with speech analytics.
THE VALUE OF VISUALIZATION
The big data revolution has made the daily, perhaps even hourly or minute-to-minute analysis of data an enterprise-wide vital activity. However, good decisions can be made only when there is good information.
Mark Kaelin for Tech Republic

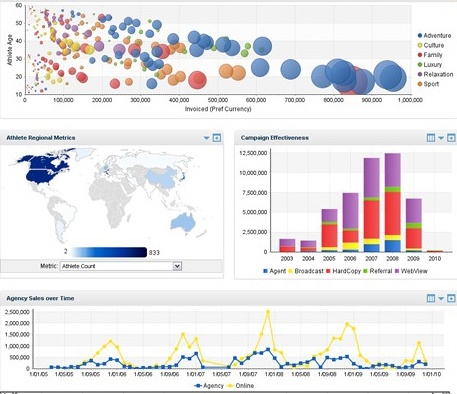
Data visualization tools and techniques offer decision makers new approaches to dramatically improve their ability to grasp information hiding in their data. Below we highlight 5 reasons to combine spoken information in your data visualization efforts.
IDENTIFY AND ACT ON EMERGING TRENDS FASTER.
Spoken content is some of the most candid and timely customer data you can get. The faster businesses can summarize, understand and act on what their customers say, the better customer loyalty and retention they see. By populating your organization’s existing dashboards and graphs with this new data, every department will be able to quickly adjust to new trends, both positive and negative such as; marketing campaign results, service outages/bugs, new product offerings, sales, and more.
MAKE IT ACCESSIBLE TO A LARGE AUDIENCE

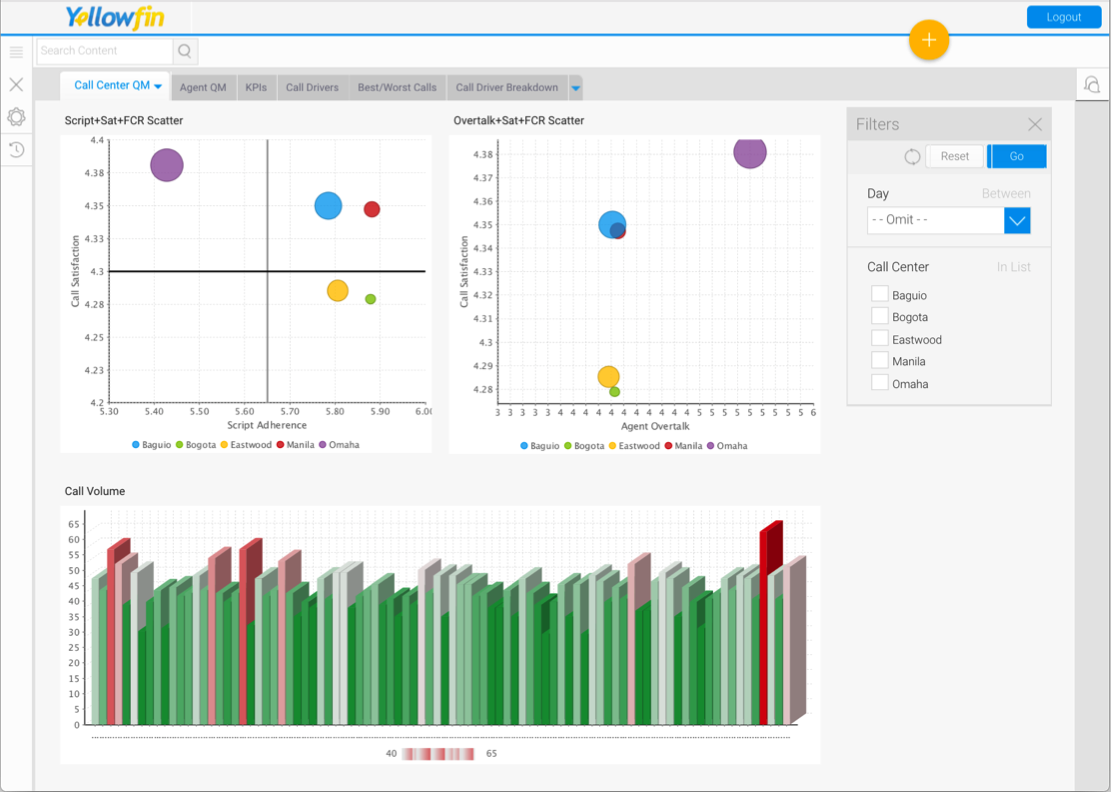
Many departments either drive calls, answer calls or make calls- and all of those departments deserve data on how those calls are going, what is working, not working and what they can do better. By populating dashboards and graphs with results on ‘what was said’ on the phone lines, as well as the meta data to put that call into context, your organization’s sales, marketing, customer service and executive team can all view and drill-down into the elements of calls that matter most to them. Allow your team to slice and dice this data in different ways in order to uncover patterns and behavior that will help improve or automate business processes on a massive scale.
SUMMARIZE BIG DATA
Big data has the name ‘BIG’ for a reason, there are massive amounts of it, complete industries have been created just to help organizations harness it, organize it and understand it. Visualization is essential to the analysis of big data so it can be of highest value and result in improvements that matter. VoiceBase can detect thousands of data points from a single call, from the words that were said to the speed of talking and the pitch and energy used- there are so many variables that can be measured one call, visualization opens the floodgates to harness and analyze it all in a clean and readily available format.
TELL A STORY
“A picture is worth 1,000 words.” We’ve all heard it before, and probably said it at some point. It is widely understood that people can gather information much quicker through images than text. When you have to present data to others, especially to get them to approve of a change or new cost, it can be hard to make your argument through text and data sheets. By visualizing your data you can paint a better picture in the minds of others and present them with something that they can relate better to and understand easier.
HELP SIMPLIFY COMPLEX INFORMATION
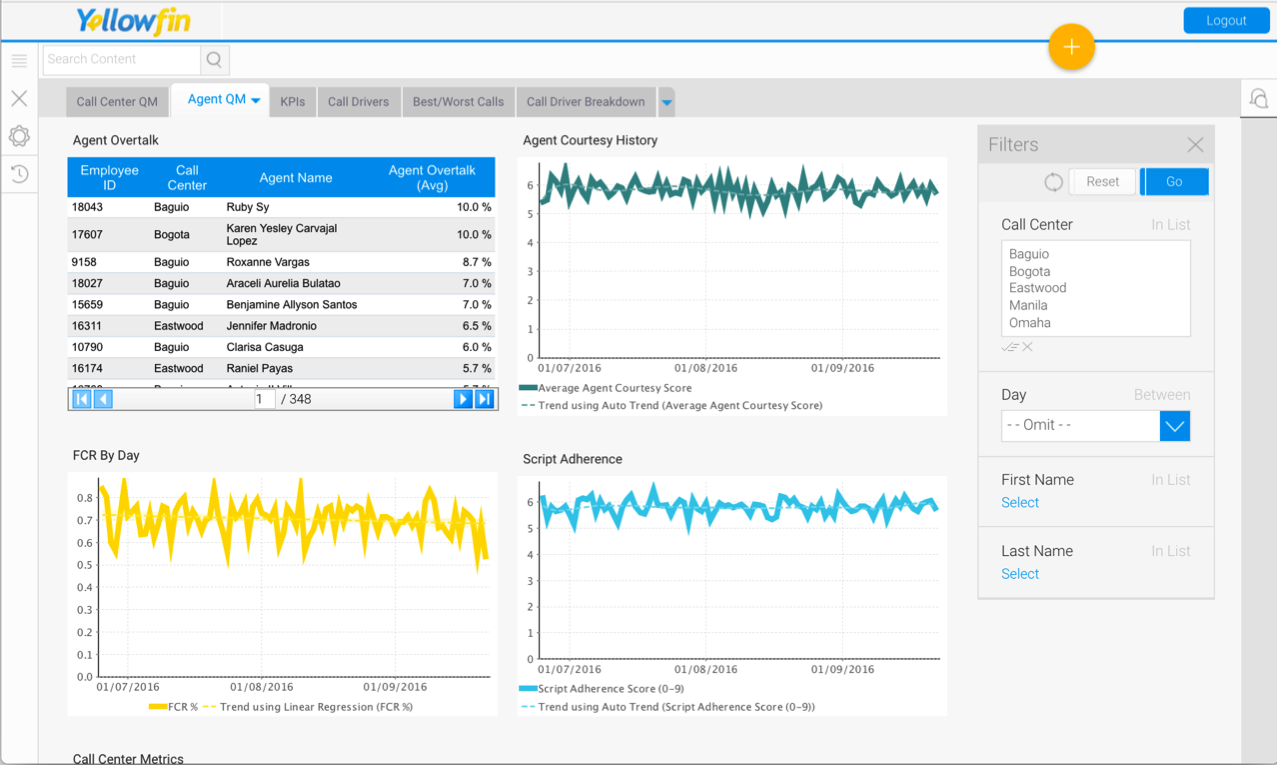
Calls have thousands of unique data points that can be measured and analyzed – the easier you can make that information to consume, the better results you’ll have when sharing it with others. By presenting your call center calls or sales team’s calls in a visual graph or dashboard, businesses will be able to share their valuable results with a wider audience, like all of your agents, and be confident their message was understood in order to effect change.


